Viewing Source Data
Every source has a hub table behind the scenes in Databricks that represents all of the input data brought into the source.
Querying Source Data in Hub Tables
All source data is visible via hub tables stored in the hive_metastore catalog in Databricks.
To query a source, open a Databricks SQL query or notebook and use: dataforge.hub_
The Source ID appears in the site URL when a Source is open, or in the list on the main Sources page. For view names, use the project schema from project settings.
Examples:
Data View Tab
The Data View tab is only available for Private Enterprise customers.
The Data View tab shows a Source's data. Standard customers clicking the tab are redirected to the hub table in Databricks. Users can filter and sort data to validate enrichment and validation rule execution.
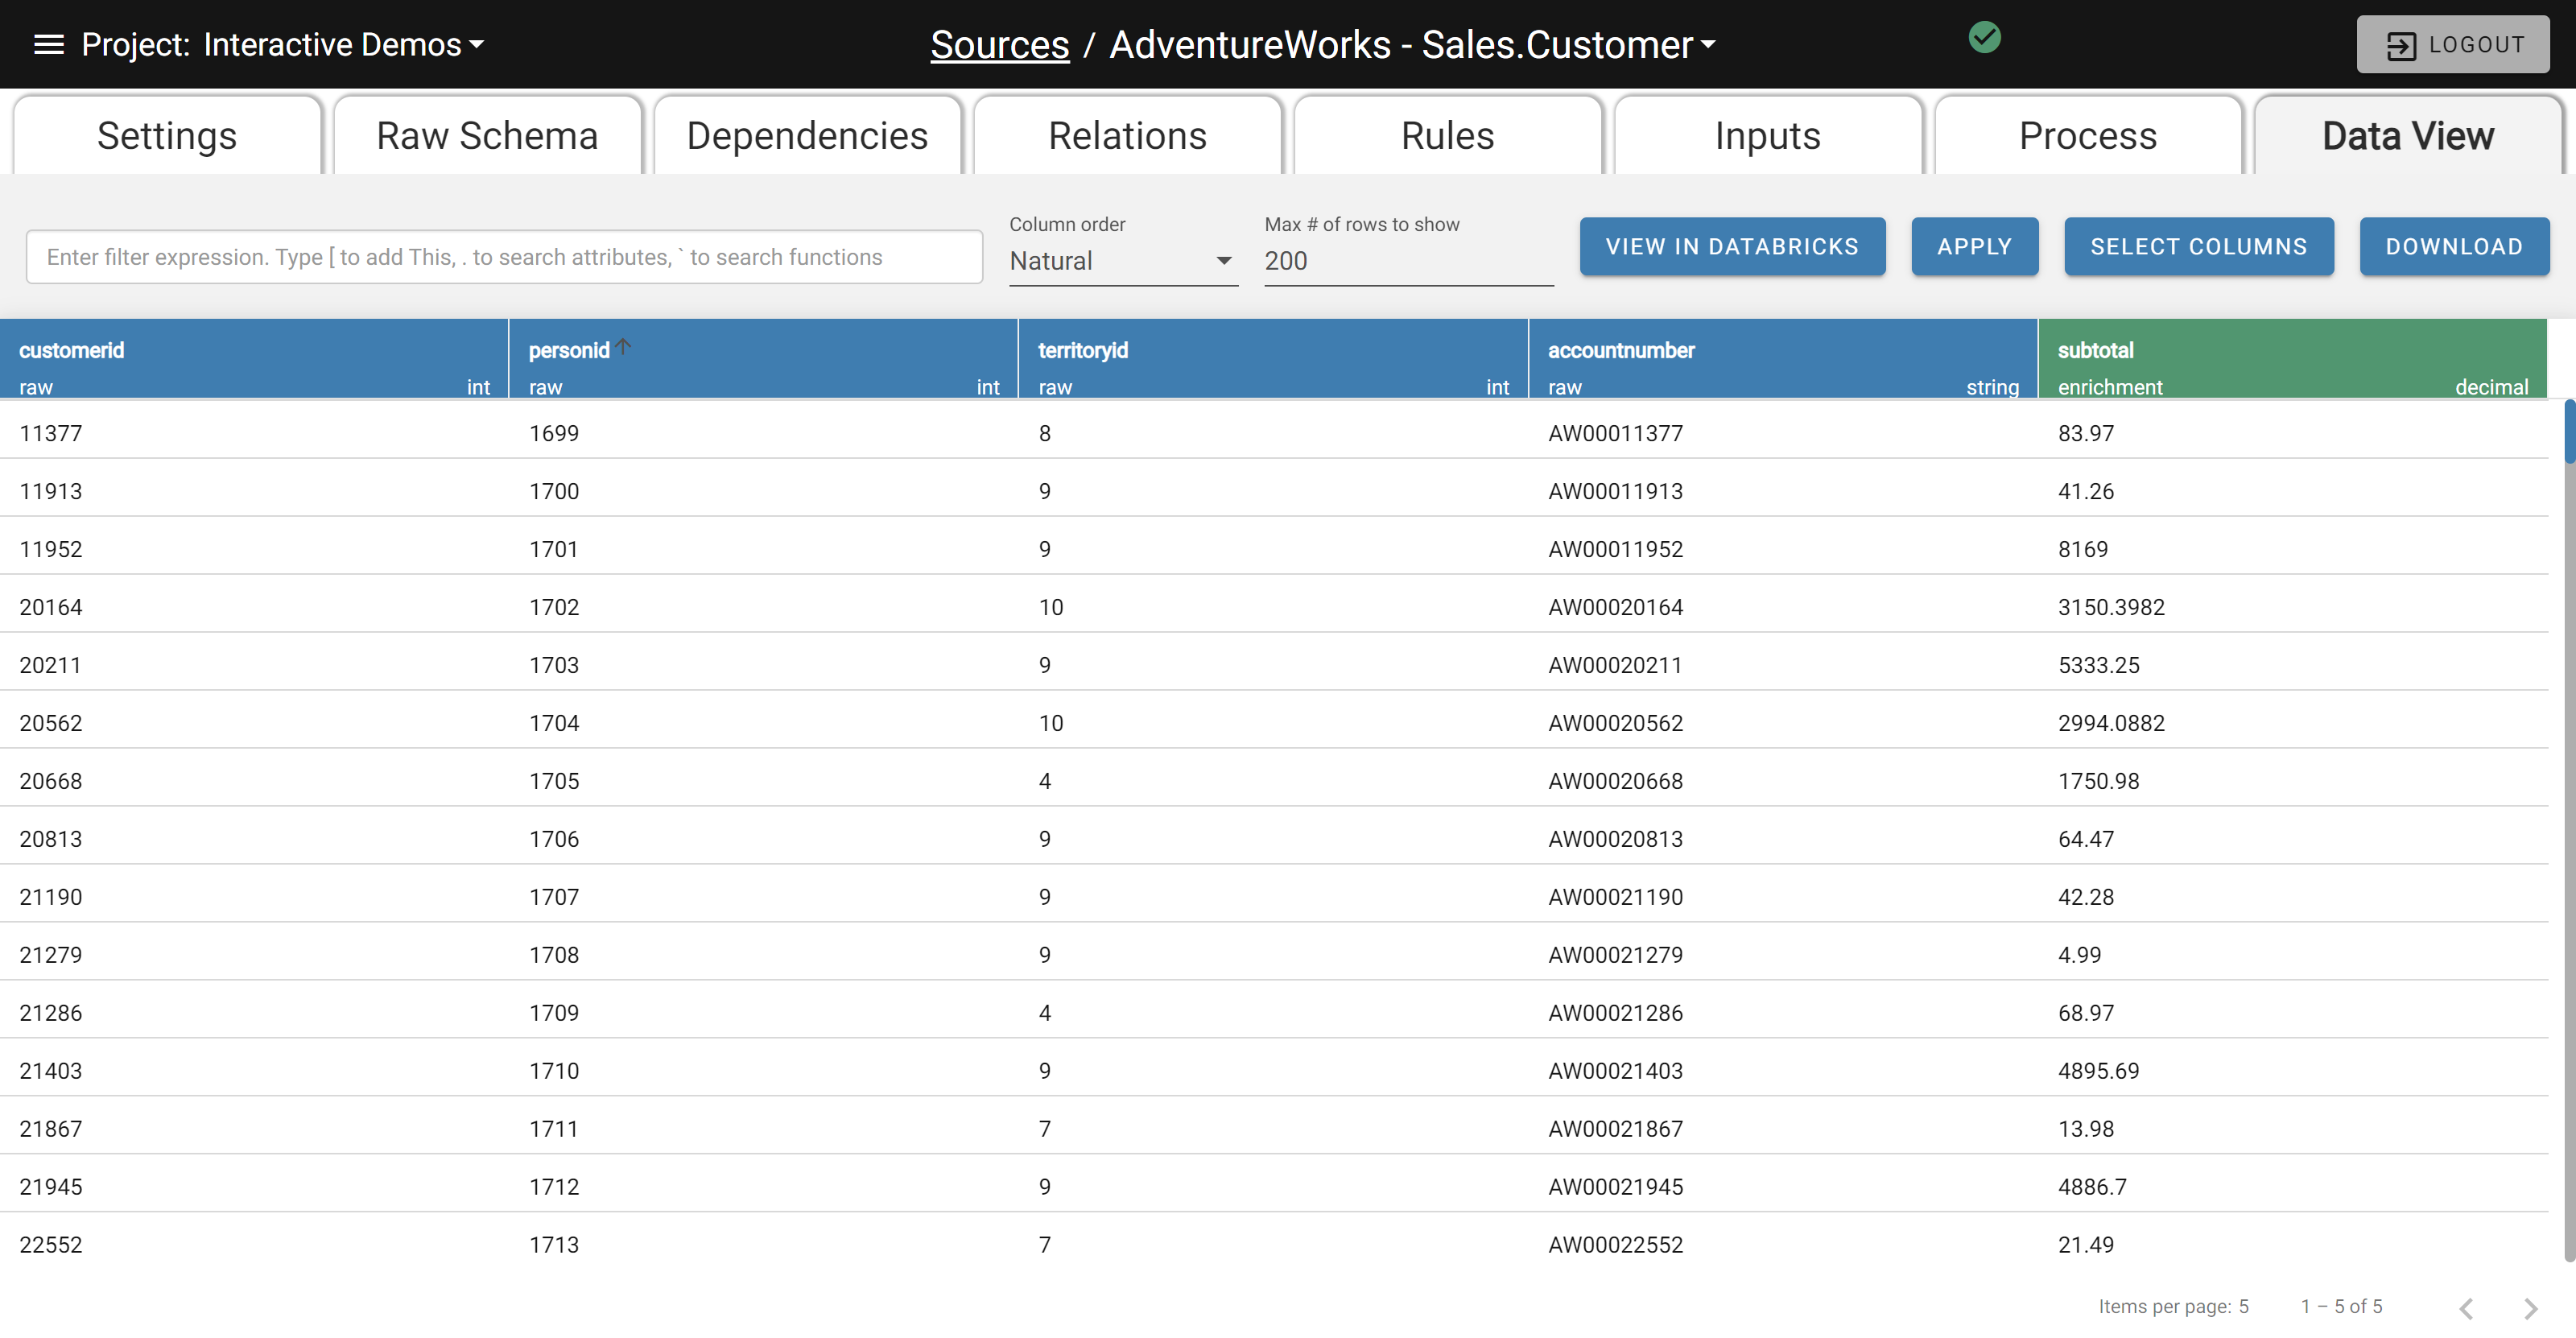
The Data Viewer Screen
Column headers are color coded to indicate Raw vs. Enriched vs. System data.
- Blue Header: Raw data from the Source
- Green Header: Enriched data generated by Enrichment Rules
- Gray Header: System data tracking data lineage and results of Validation Rule execution
Rows are color coded to indicate a record's Validation flag.
- White Row: Records that pass Validation
- Yellow Row: Records warned during Validation
- Red Row: Records failed during Validation
Filtering Results
Filters and column selections are retained per browser and source until cleared.
Typing IQL
Type DataForge QL in the top bar to filter data, using [This].field as in enrichment rules. The ` key accesses common Spark functions.
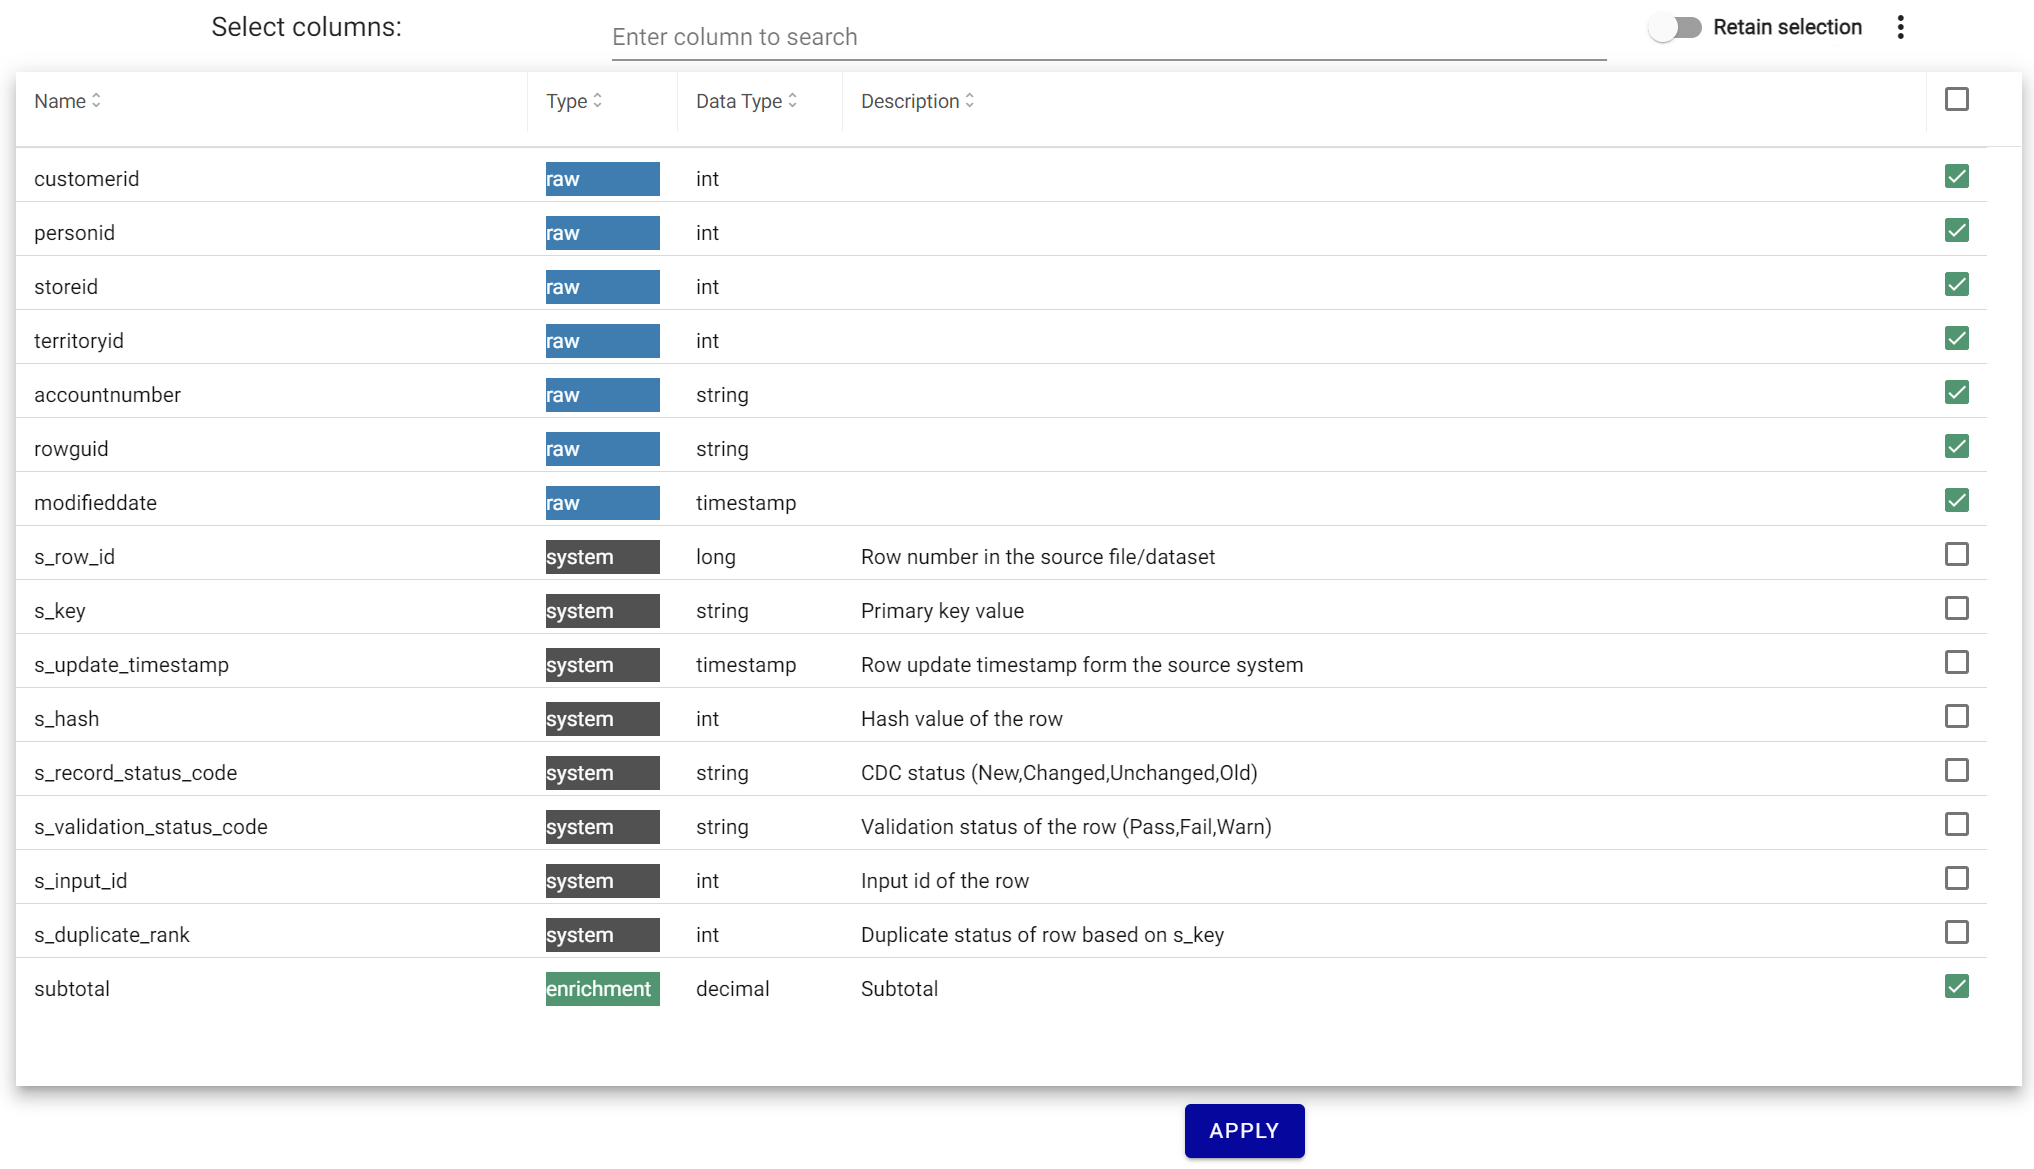
Selecting Columns
Click Select Columns to choose visible columns and see data types. Use the text box to filter the column list. If Retain Selection is off, only columns matching the current filter are shown.
Sorting Data
Clicking a column's name sorts the data in ascending order. Clicking again switches to descending order.
Column Name
Downloading Data
The Download button exports the filtered/sorted data as a .csv.