Production Workload Compute Configuration Recommendations
Best practices for production Compute Configurations in DataForge. Read the Spark and Databricks Overview first to understand how DataForge, Databricks, and cloud providers work together.
Overview
Compute configurations can be tuned to meet processing SLAs. In development, optimizing idle settings reduces wait times. In production, tune for both stability and cost optimization, and revisit as source data grows.
Compute Configuration Types
Job: Starts and shuts down entirely based on DataForge configuration. Expect a 3–5 minute provisioning wait when a new compute is needed. Instances shut down after processing completes once Max Idle Time elapses.
Job from Pool: Uses both the DataForge Compute Configuration and a Databricks Pool configuration. If the pool has an idle instance ready, startup time is reduced by 1–2 minutes; otherwise DataForge waits for provisioning. Instances shut down based on the pool's idle termination settings.
Compute Type Guidance
For production workloads, use the Job compute type with the Spot with Fallback setting. This uses spot instances when available and falls back to on-demand, minimizing cost. Spot with Fallback is only available on Job-type computes, not Job from Pool (a Databricks limitation). Set First On Demand to 1 so the driver node is always on-demand — spot workers can be reclaimed without failing the job, but if the driver is reclaimed the job fails. See the Compute Configuration Example for a screenshot.
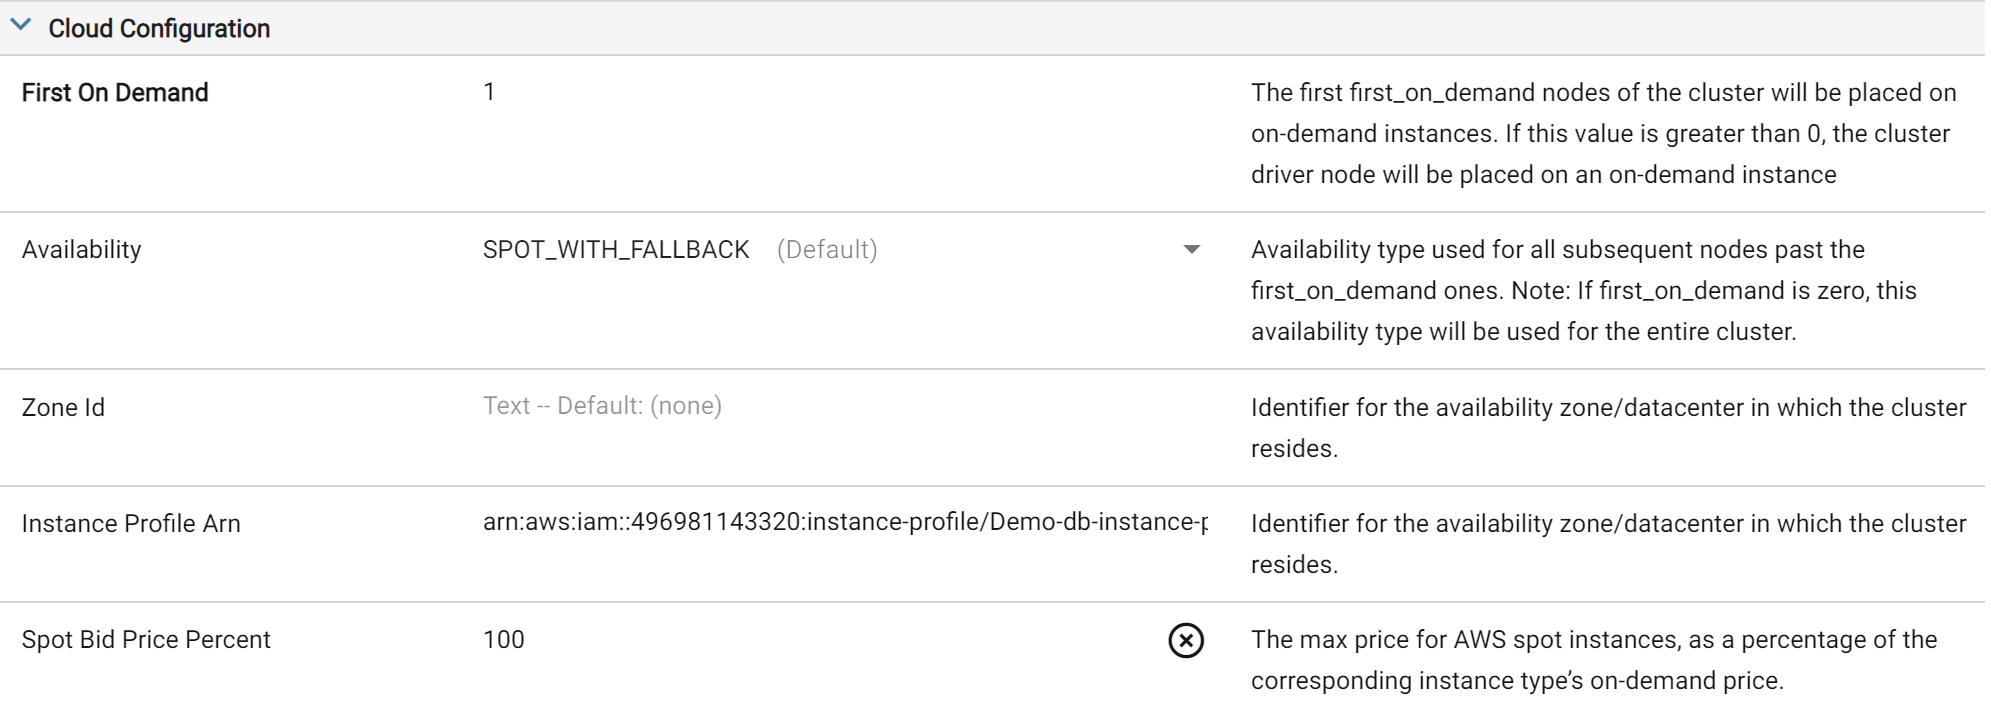
Example AWS Settings on Cloud Configuration
Pools keep instances warm (saving 1–2 minutes of launch time), but have two downsides: they can only be fully Spot or fully On-Demand, and idle instances still accrue cloud costs until the Instance Idle Auto Termination setting shuts them down.
Prefer Job-type with Spot with Fallback. If launch times are missing SLAs, tune the Idle Time and Max Idle Compute settings in DataForge.
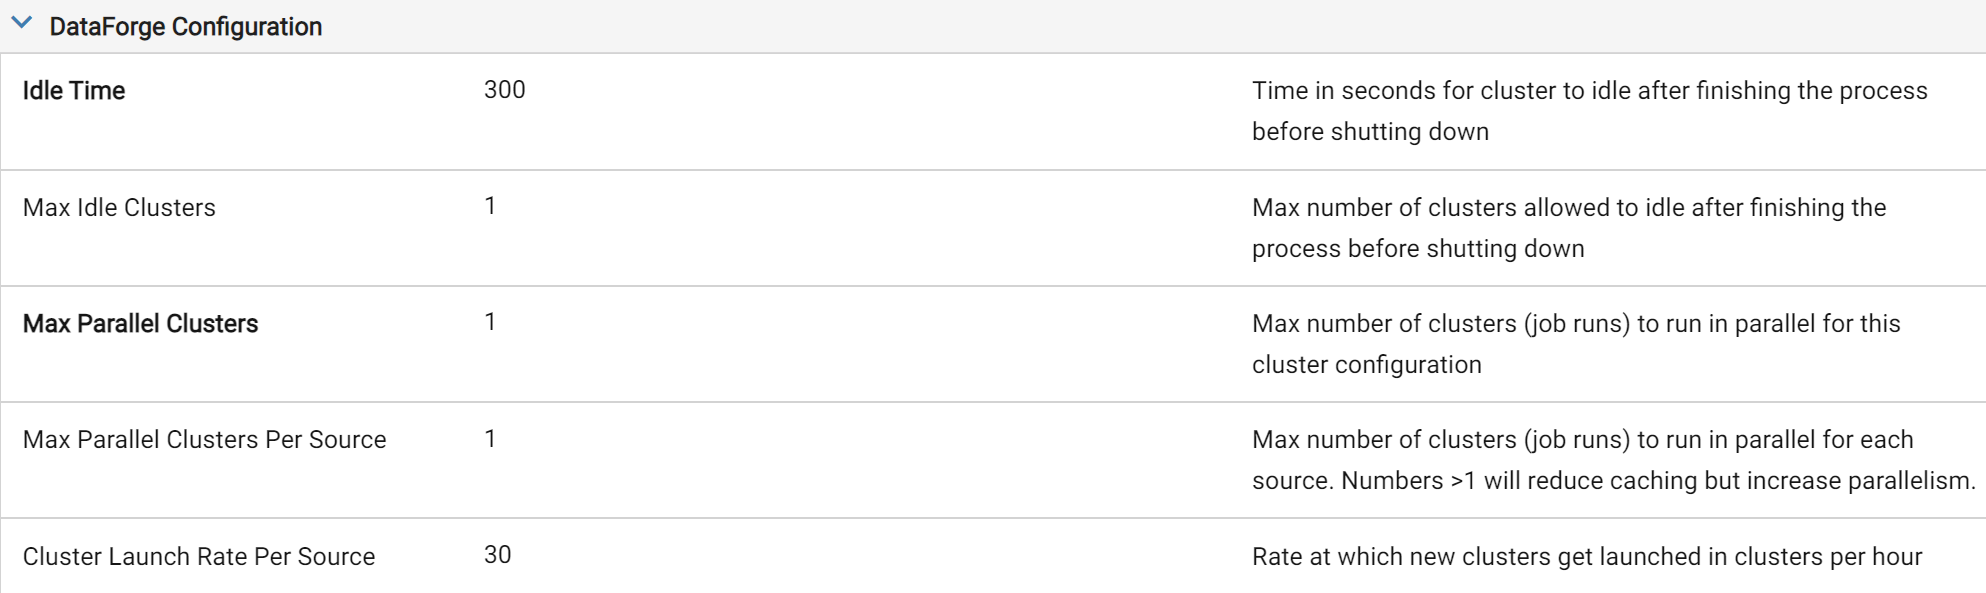
Max Idle Compute keeps X computes idle for reuse; Idle Time controls how long they stay idle before shutdown. Together, these settings let you keep Spot with Fallback computes warm between jobs — eliminating the 3–5 minute provisioning wait at the cost of idle cloud/Databricks charges.
Scale Mode Guidance
DataForge supports two scale modes. Fixed — specify the exact number of worker nodes. Automatic — set a min/max range and Databricks scales within it based on job demand.
Use Fixed when job size (input/hub table size) is known and stable. Use Automatic when compute needs vary widely or are unknown; switch to Fixed once requirements stabilize for best performance and cost efficiency.
Instance Type and Number of Workers Guidance
Avoid defaulting to the cheapest instance type and adding more workers to compensate — it's usually not the most efficient approach.
Scaling up means upsizing the instance type (e.g. xlarge → 2xlarge); scaling out means adding worker nodes while keeping the instance type.
Each compute has a Driver Node and Worker Nodes of a chosen instance type. For example: AWS m5n.xlarge = 4 vCPUs/16 GiB; Azure Standard_DS3_v2 = 4 vCPUs/14 GiB.
Total vCPUs = (workers × vCPUs/node) + driver vCPUs. For example, 10 × m5n.xlarge workers = 44 vCPUs (40 worker + 4 driver).
We recommend aiming for 5-10 workers in a compute and adjusting the instance type to match the total number of vCPUs and Memory needed for the job.
Fewer nodes with larger instance types can improve performance and cost-efficiency, but must be balanced against spot availability risk.
Cloud providers limit spot instances per region/AZ and may reclaim them at any time. If too many workers are reclaimed (or the driver is reclaimed), the job fails and retries based on Source retry settings. Use the spot advisors below to choose instance types with the vCPUs/memory you need and low interruption frequency:
AWS Instance Advisor: https://aws.amazon.com/ec2/spot/instance-advisor/
Azure Spot Instance Advisor: https://azure.microsoft.com/en-us/pricing/spot-advisor/
Google Cloud Spot VMs: https://cloud.google.com/compute/docs/instances/spot
Be sure to select the correct Region matching the Region your DataForge environment is deployed in.
Below is an illustration of a compute with many workers and how it can be converted to a larger instance type with fewer workers to reduce spot availability interruptions.
| AWS | |||||||
|---|---|---|---|---|---|---|---|
| Instance Type | vCPU per Node | Memory per Node | Num Workers | Total Num Nodes (incl Driver) | Total vCPUs | Total Memory | |
| Compute 1 | m5n.large | 2 | 8 | 40 | 41 | 82 | 328 |
| Compute 2 | m5n.2xlarge | 8 | 32 | 10 | 11 | 88 | 352 |
| Azure | |||||||
| Instance Type | vCPU per Node | Memory per Node | Num Workers | Total Num Nodes (incl Driver) | Total vCPUs | Total Memory | |
| Compute 1 | Standard_DS3_v2 | 4 | 14 | 20 | 21 | 84 | 294 |
| Compute 2 | Standard_DS4_v2 | 8 | 28 | 10 | 11 | 88 | 308 |
| GCP | |||||||
| Instance Type | vCPU per Node | Memory per Node | Num Workers | Total Num Nodes (incl Driver) | Total vCPUs | Total Memory | |
| Compute 1 | n4-standard-4 | 4 | 16 | 20 | 21 | 84 | 294 |
| Compute 2 | n4-standard-8 | 8 | 32 | 10 | 11 | 88 | 308 |
Tuning Compute Configurations
Use the Spark UI and Metrics provided by Databricks. To access: go to the Process tab of a source (or the main Processing page), click the Job Run ID link, then select Databricks.
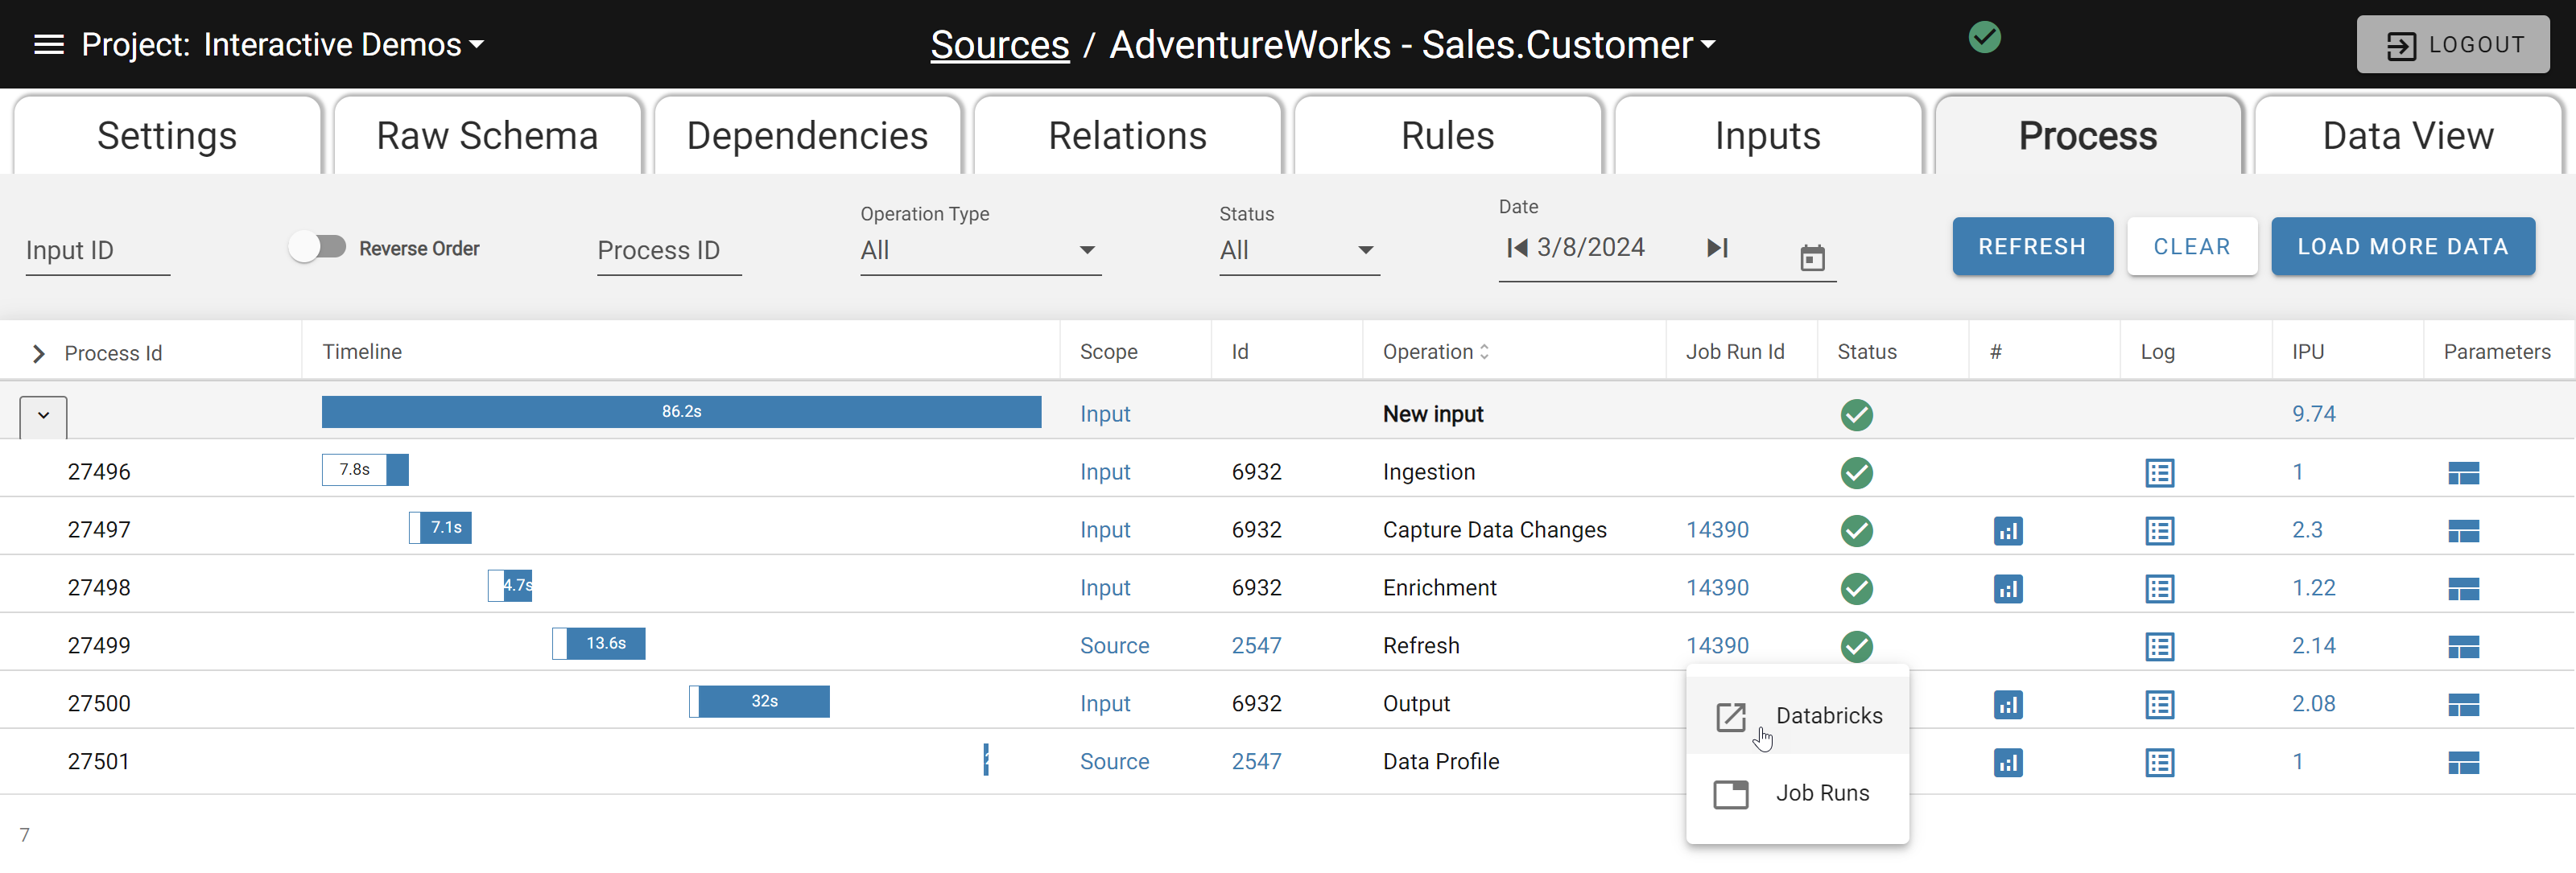
Navigating to Databricks from DataForge Process link
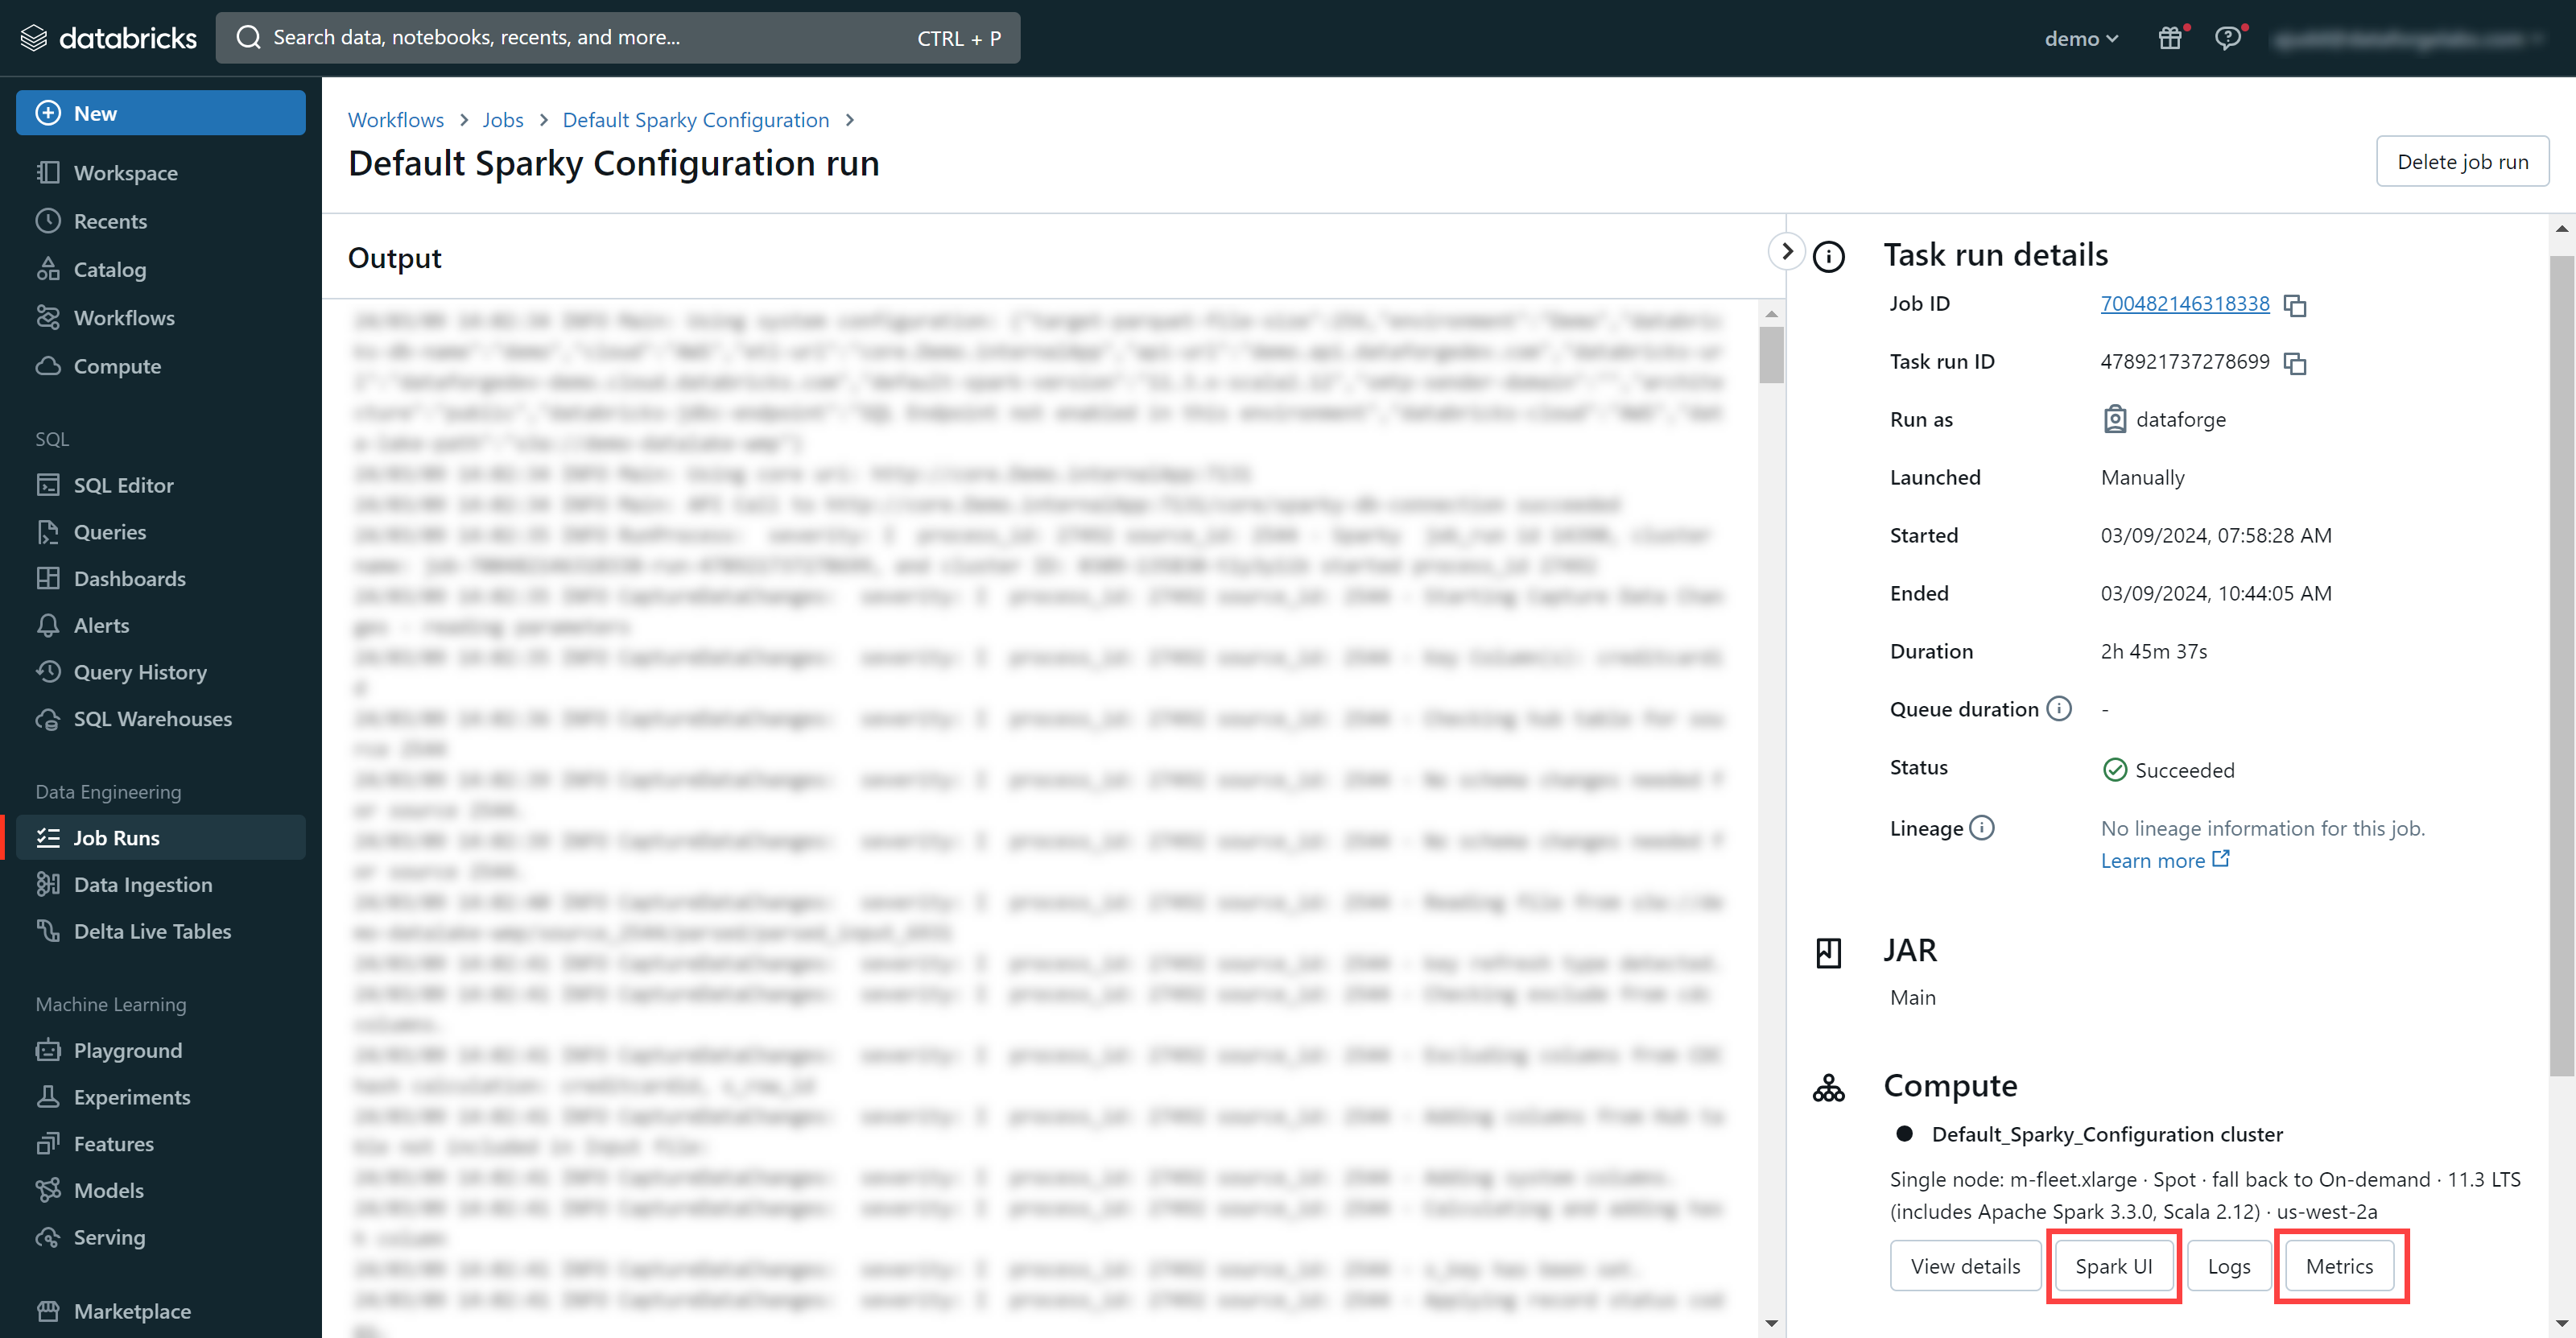
Selecting Spark UI or Metrics within Databricks
In the Spark UI (Jobs or Stages tab), note the total task count and how many run concurrently — concurrent tasks = total vCPUs. High task counts indicate more opportunity to increase parallelism with larger instance types or more workers.
In the Metrics UI (Main tab), review the Compute Load, Memory, CPU, and Network charts. Node color in the lower half indicates utilization — aim for orange or red (fully utilized).
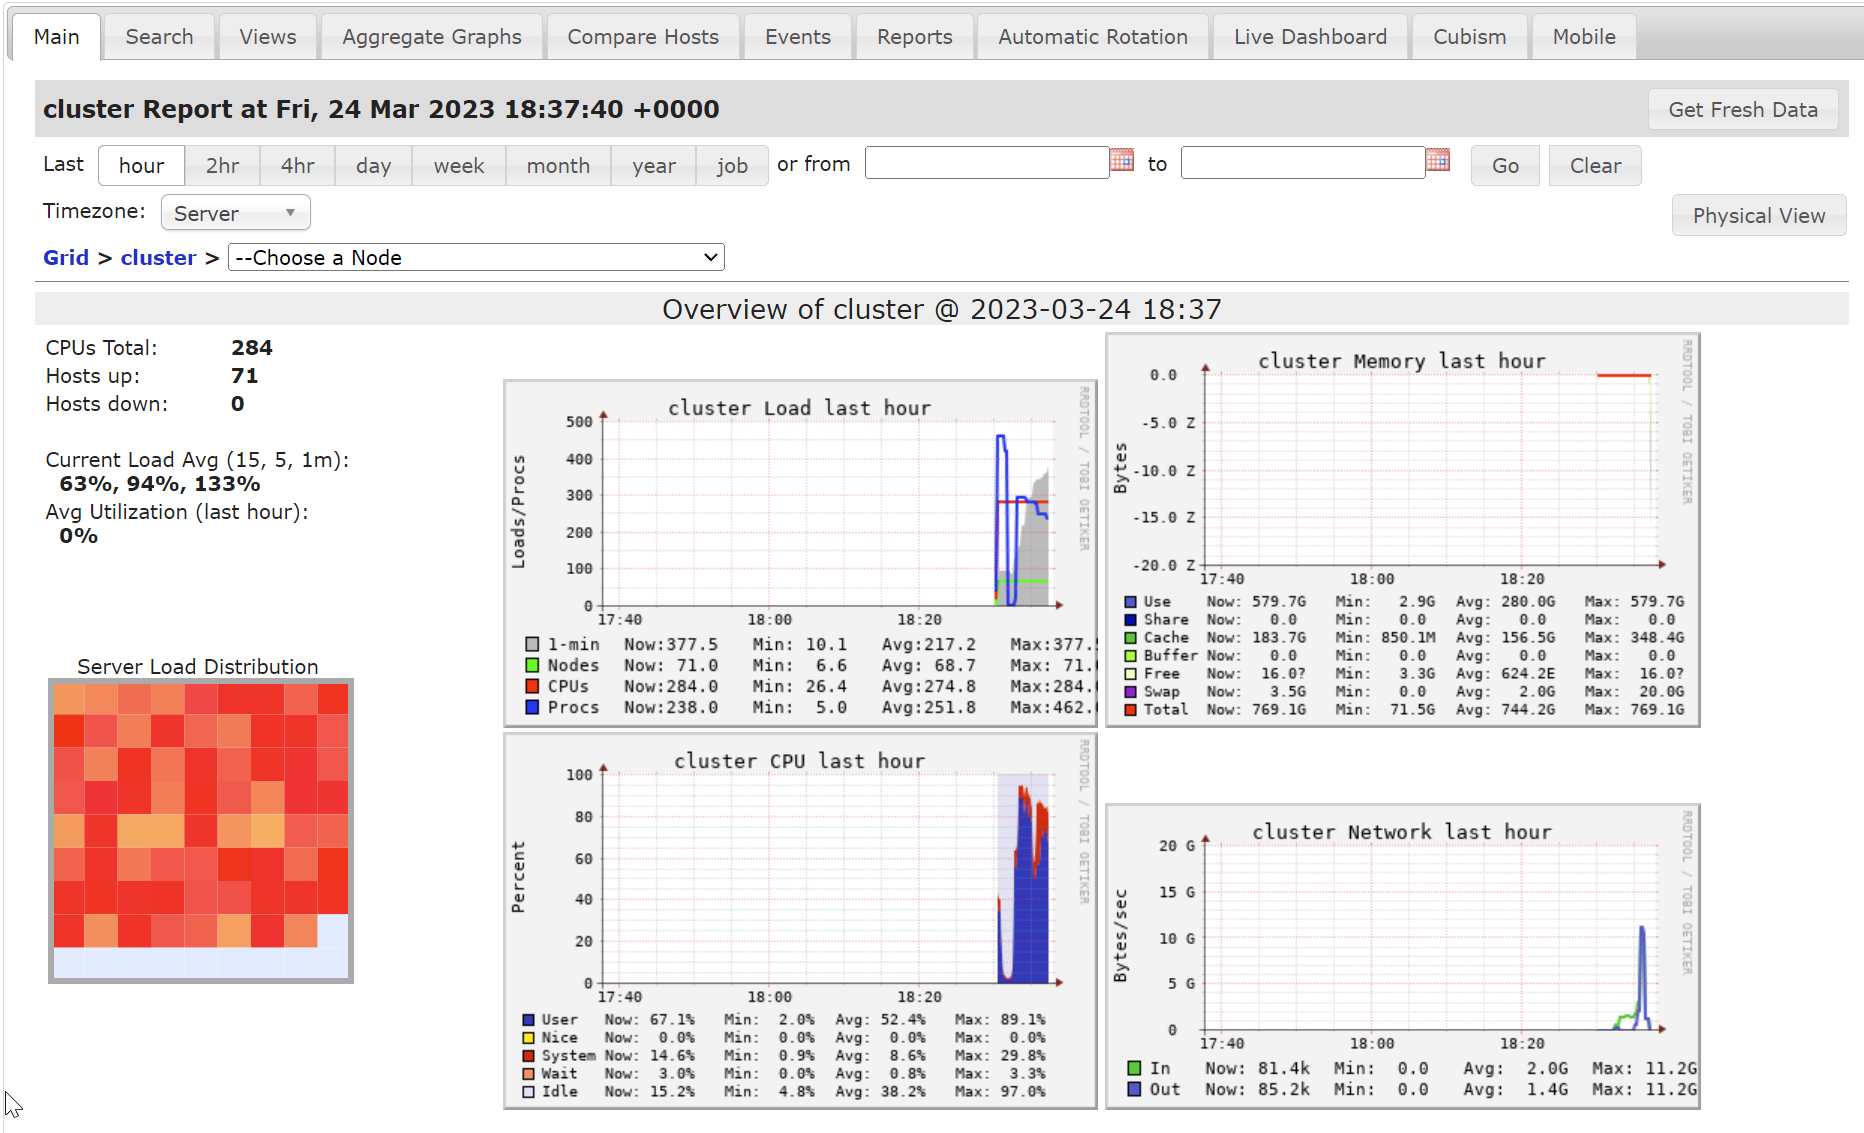
Databricks Metrics UI
Common Challenges and Recommendations
1) The processing is taking too long to complete, affecting SLAs. What should I look for and take action on?
Check the following information on the Databricks Job Run page using the Spark UI or Metrics pages.
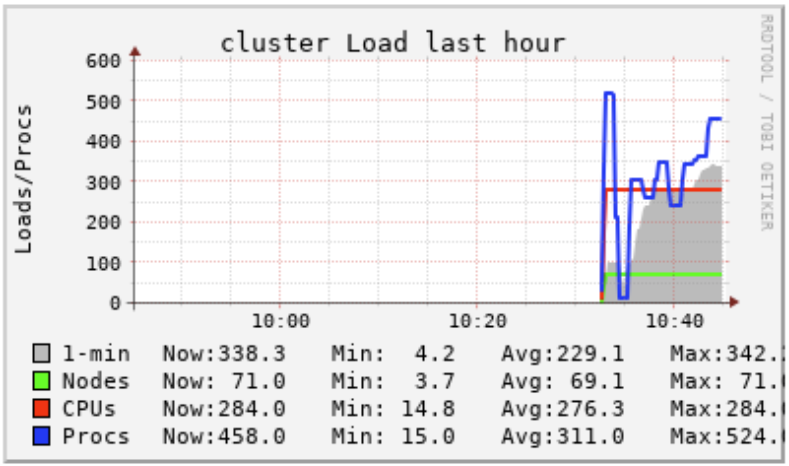
Compute Load Chart: If the 'Procs' line is consistently above the 'CPUs' line, users may want to add more total vCPUs to the compute configuration through larger instance types or more workers.
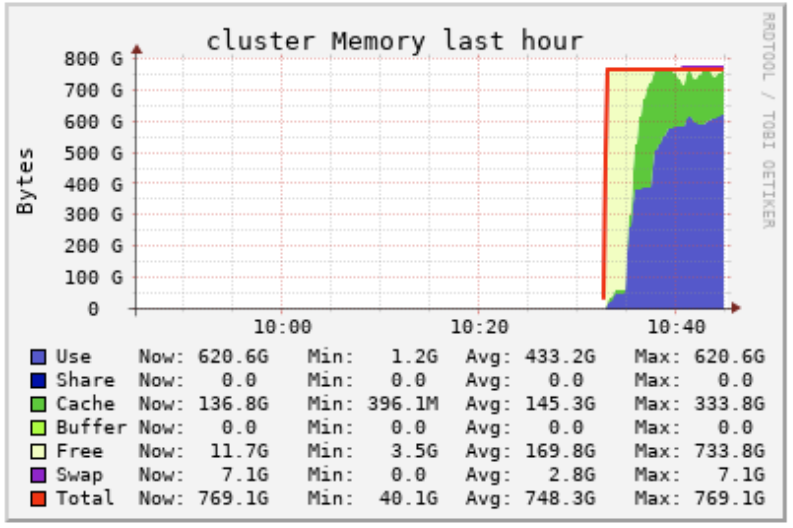
Compute Memory Chart: If the 'Use' line is consistently at or above the 'Total line', users may want to add more total memory to the compute configuration through larger instance types or more workers.
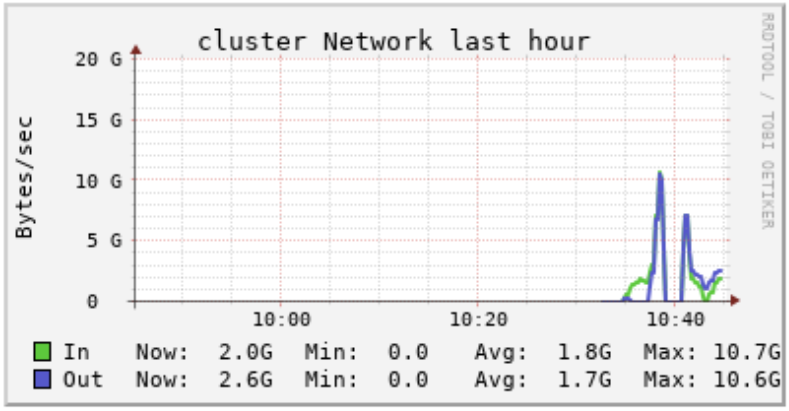
Compute Network Chart: If there are many spikes in the network while the compute is running, it is likely that workers are needing to re-shuffle data partitions across other worker nodes to complete their tasks. Users may want to upsize the instance type and reduce the number of workers, which in turn reduces the amount of re-shuffling required.
Individual Node Charts (All Red): If the driver and worker nodes are showing all red, it means the nodes are all being fully utilized. Users may want to upsize the instance type or add more workers to reduce the load on each node in the compute.
2) The processing is very quick but my costs are too high. What should I look for and take action on?
Check the following information on the Databricks Job Run page using the Spark UI or Metrics pages.
Individual Node Charts (Green or Blue): If some or all of the worker nodes are showing Green or Blue colors, it is likely that the compute is oversized and users could benefit from downsizing the instance type or reducing the number of workers.
3) Some of the processes are very quick while others are very slow using the same compute configuration. What should I do?
Use process configuration overrides! Navigate to the Process Configuration documentation to get familiar with the Process Override concept. It is common that some processes can be quicker than others. In these cases, it's best to set the Default Compute Configuration to match the CPU and Memory needs of the majority of the processes. Then add individual process configuration overrides to utilize a larger or smaller compute configuration for specific processes.
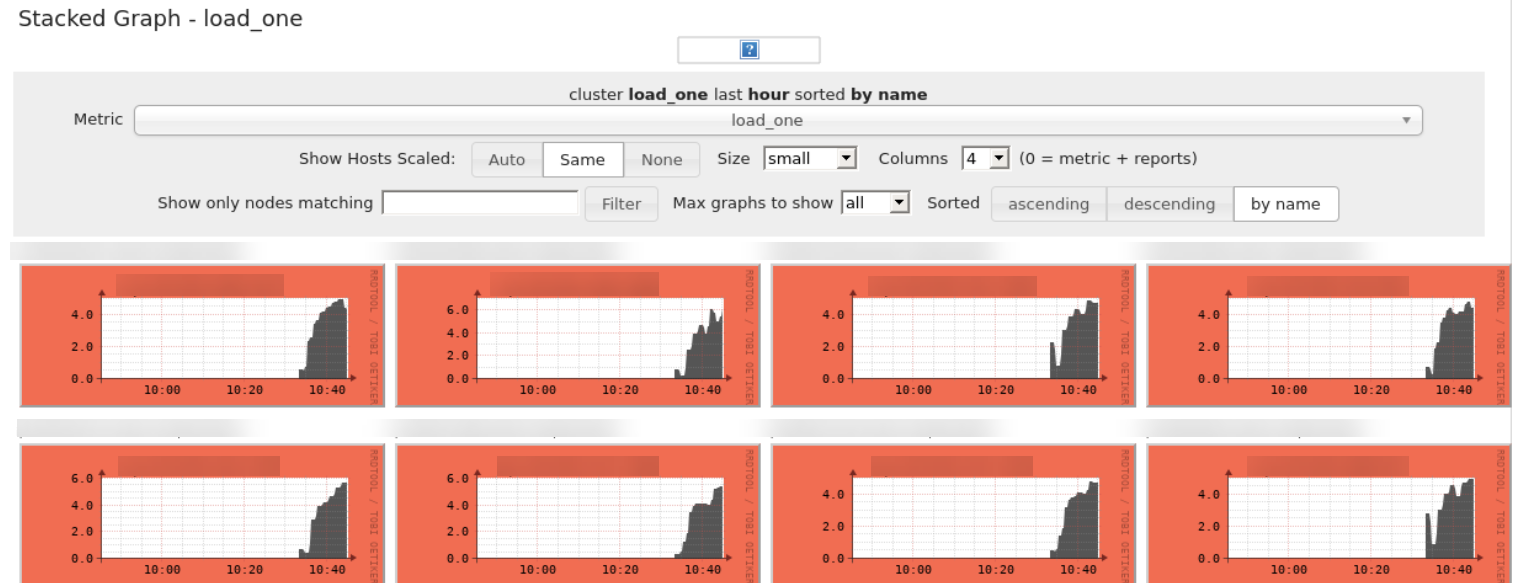
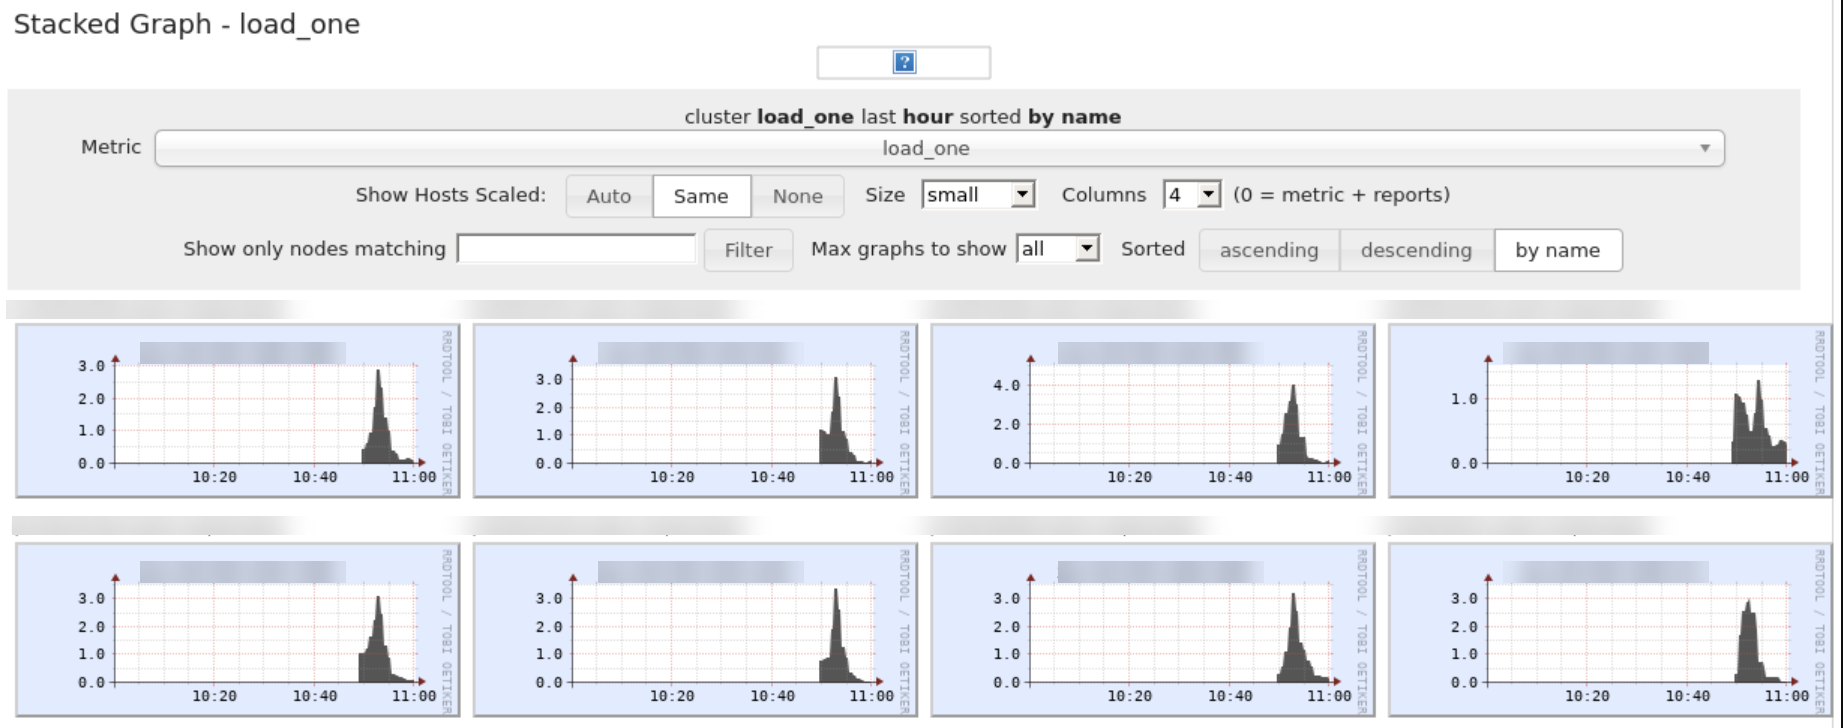
An example of when this can happen is if the source contains a large amount of data but there are very few or no relations or rules to process. This would result in the Refresh process taking longer than the Enrichment process so the user could add a process configuration override to use a different compute configuration for Refresh.

Example of Processing where Process Override helps
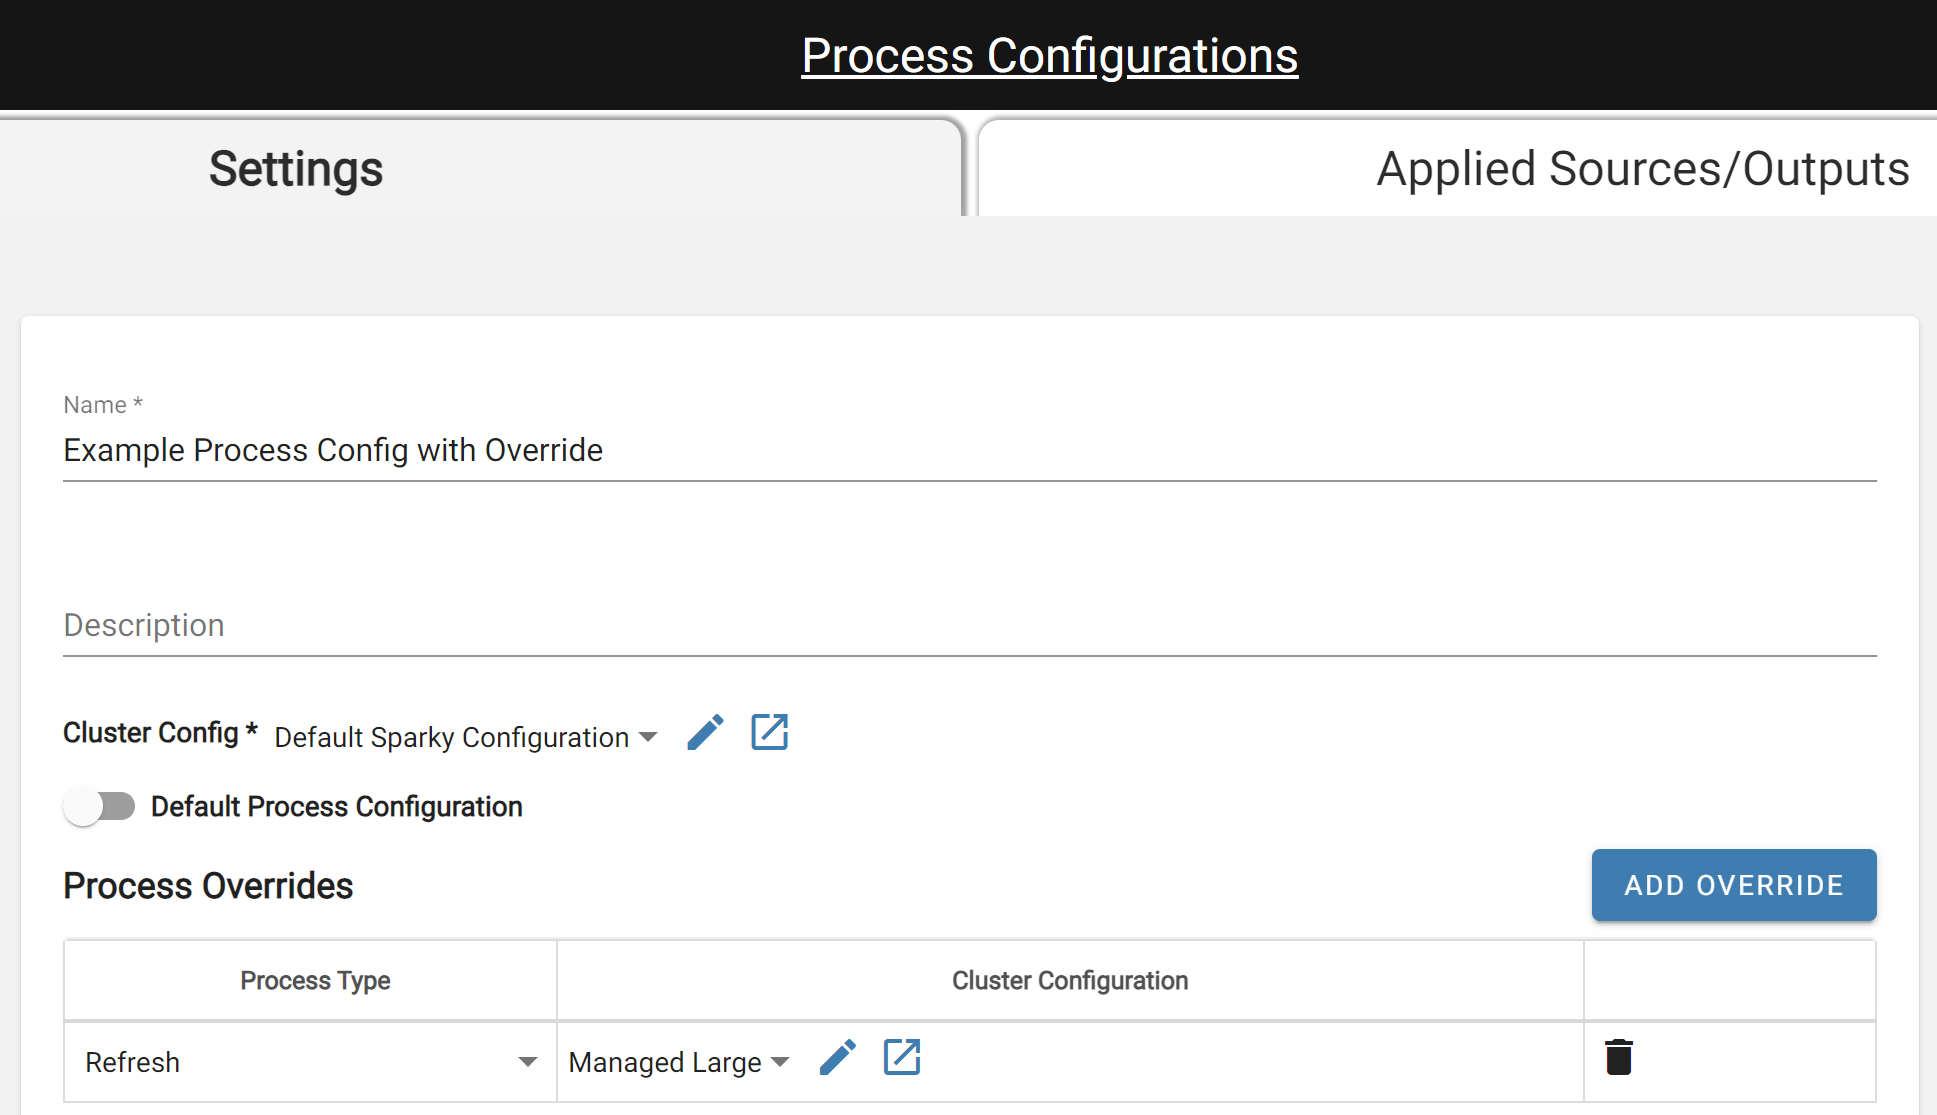
Process Config with Override for Refresh Process
4) Running data outputs from a Key Refresh Type Source to Snowflake or SQL Server is taking longer than expected, even with a large compute configuration in DataForge. What should I do?
Check the output process logs in DataForge for a completed output run and look for the messages "Running key delete query" and "Delete query complete". Compare the time it took between these two messages to the overall process time. If the majority of the time is spent waiting between these messages, then users could speed the output process up by increasing the Snowflake Warehouse. Similarly, users could increase the compute size in SQL Server to speed the process up. This is because DataForge handles the process up to the point the temp table is created, and then relies on Snowflake and SQL Server compute to complete the key deletes to update the existing table. When Snowflake/SQL Server finishes, they send the 'all clear' back to DataForge to finish the process and mark it as a success or failure.
5) Periodically, processes are failing because of spot availability with jobs frequently running on 30-minute and hourly cadences. What should I do?
The first settings to think about tweaking in a production environment that has jobs constantly running are the compute configuration Idle Time and Max Idle Compute parameters. If compute is frequently shut down just before a new input starts processing, users can increase the Idle Time of the compute to stay idle long enough that the next time an input runs, it picks the idle compute up rather than trying to launch a new compute. If there are multiple sources starting at the same time with the same compute configuration, increasing the Max Idle Compute may help as well to keep multiple compute ready to go when the next set of inputs begin processing.
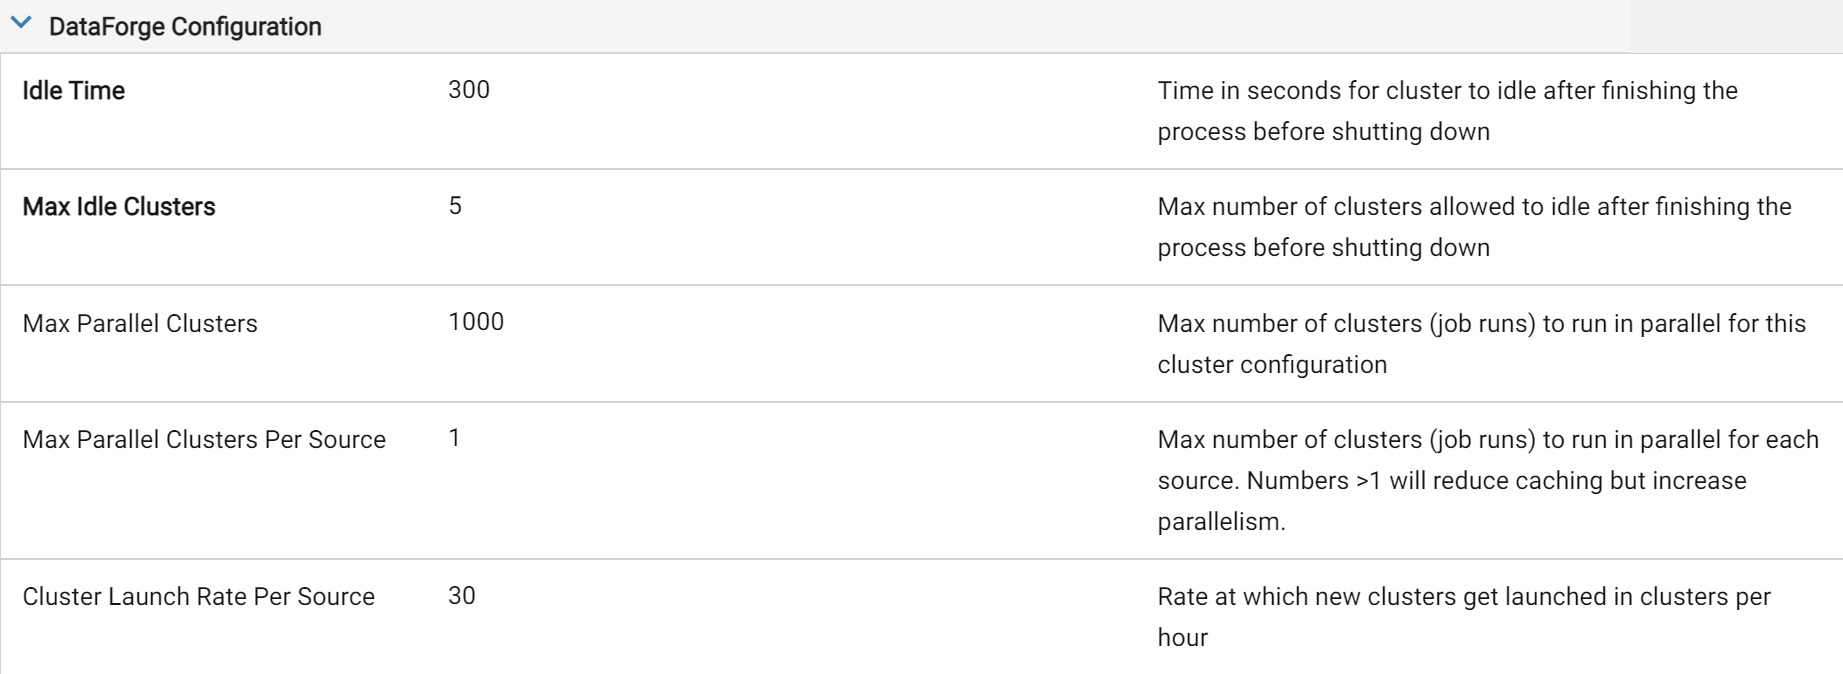
Tweaked Idle Time of 5 Minutes and Max Idle Compute of 5
6) A process failed and the DataForge logs show "Job run terminated or failed to launch. Retrying process." After opening the Job Run Databricks link, I see "AWS_MAX_SPOT_INSTANCE_COUNT_EXCEEDED_FAILURE" error. What does this mean and what can I do?
AWS sets maximum concurrent spot vCPU limits for each account. If users receive this error, it means that the maximum number of vCPUs were running at one time on Spot Availability that AWS is allowing. AWS dynamically adjusts these spot limits based on how many spot instances are used. Users can also request increases in these Spot instance limits in AWS on the Limits service rather than relying on the dynamic adjustments. For more information, visit Amazon EC2 Service Quota documentation.
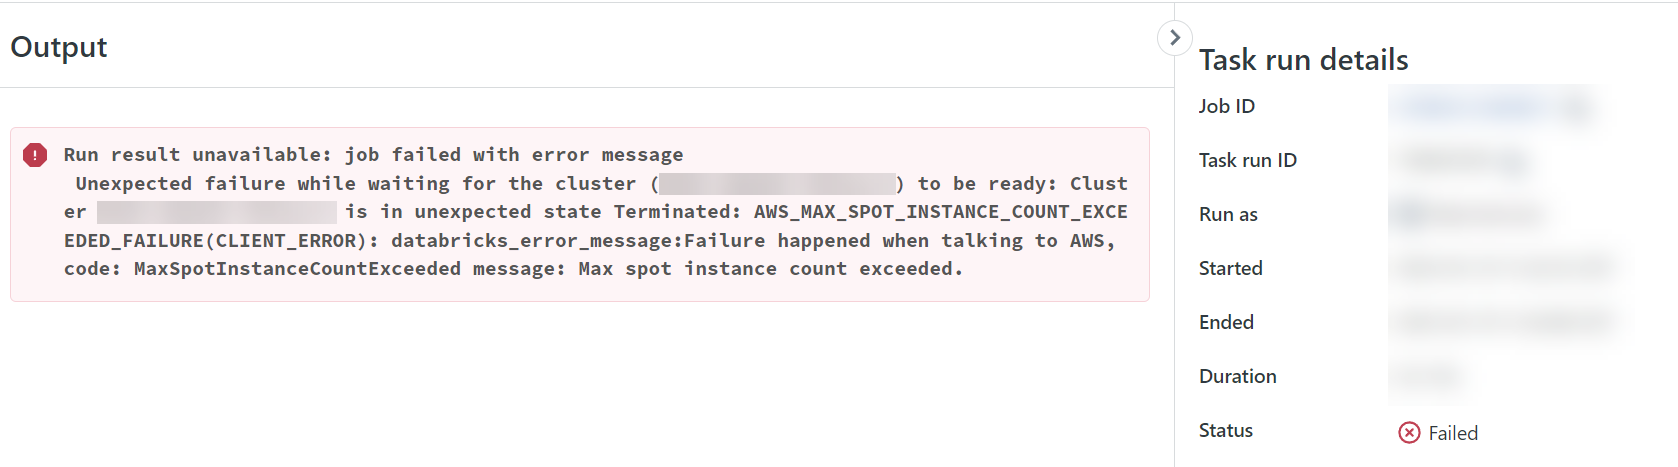
Example of Spot Limit Error
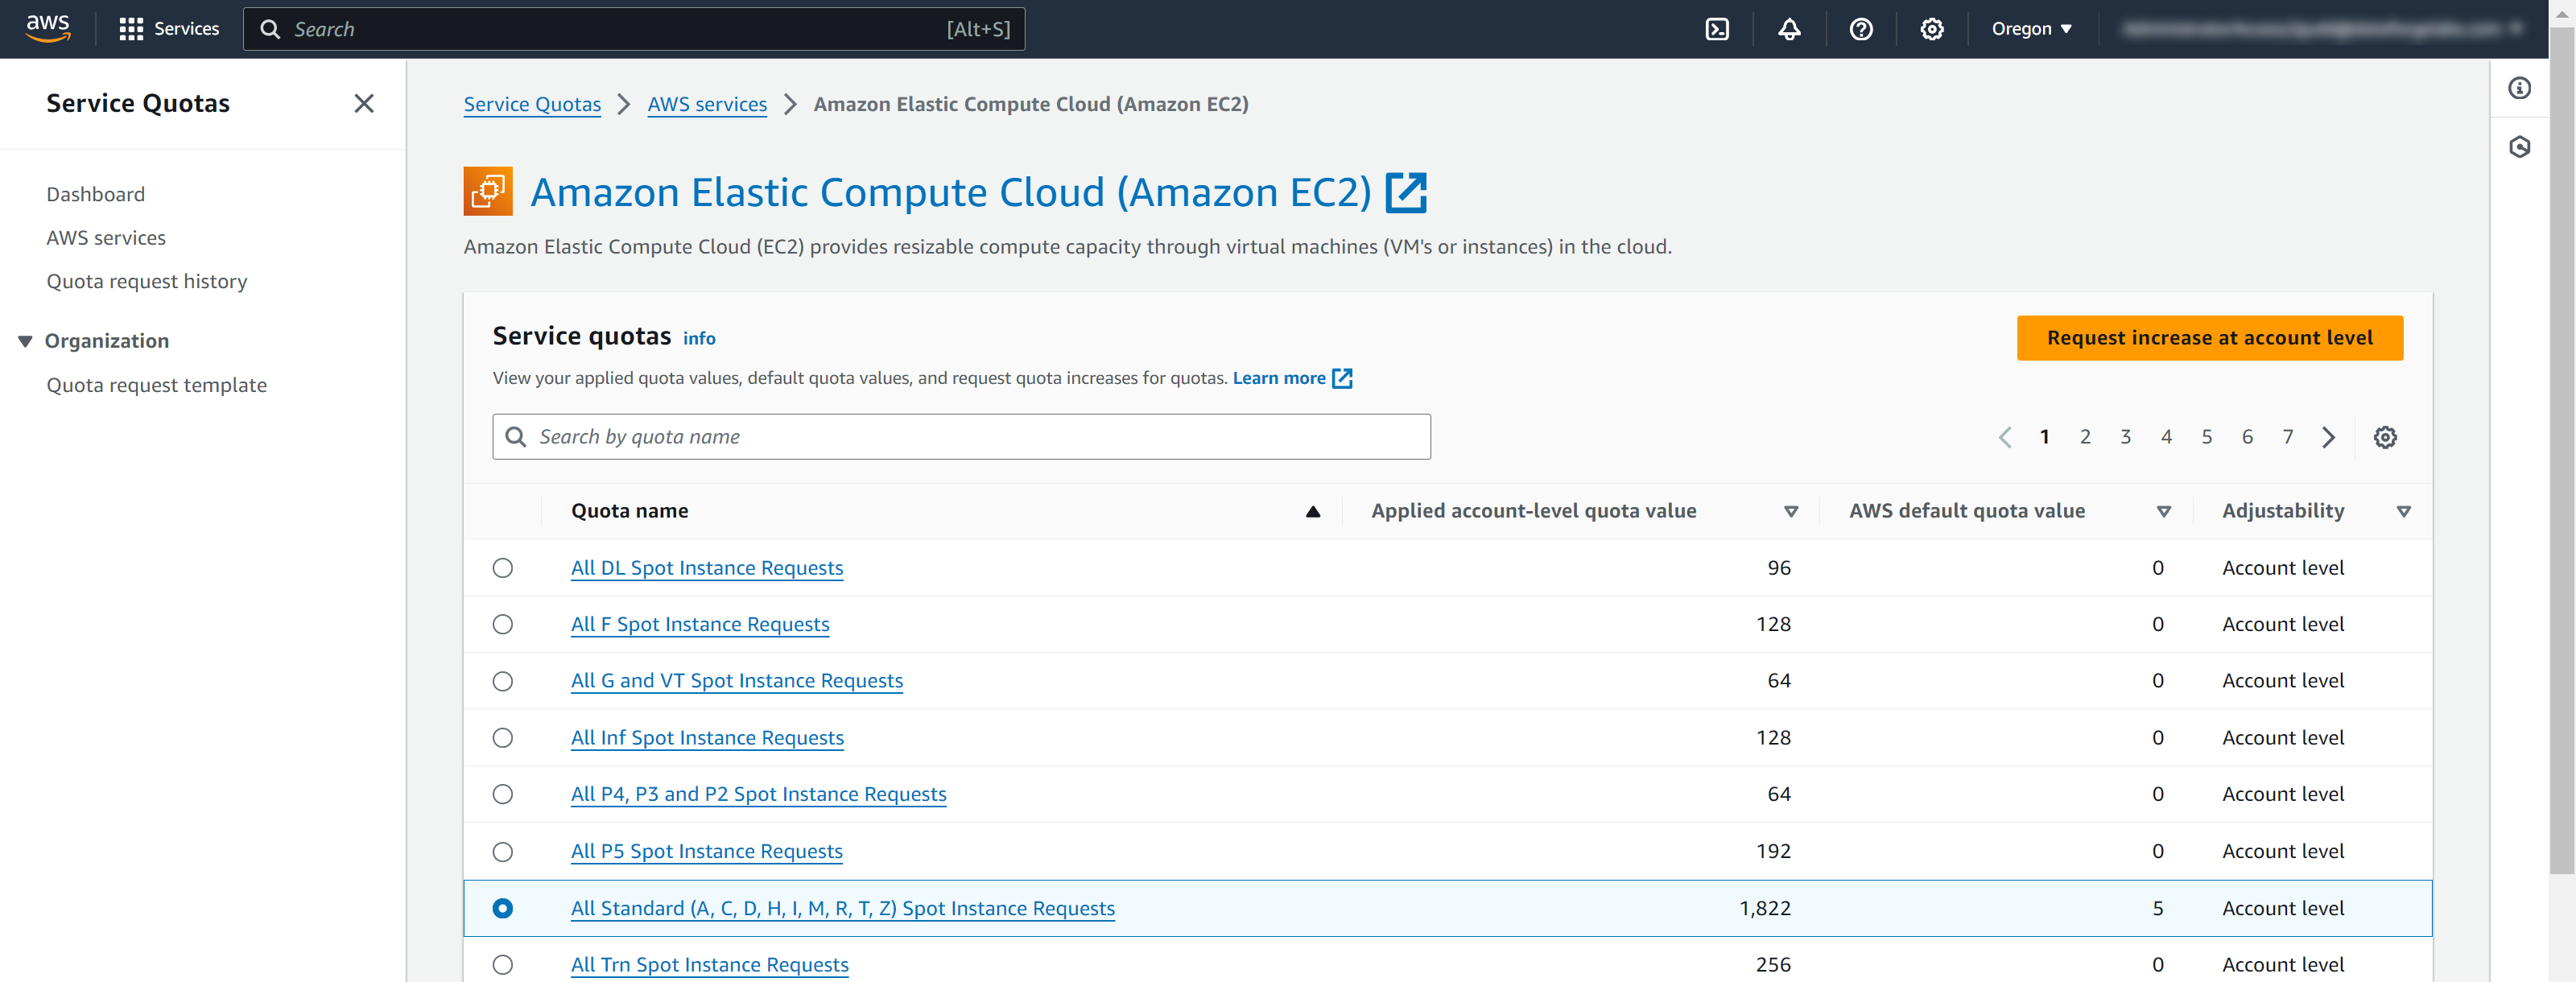
Viewing Spot Quotas in AWS and Requesting More
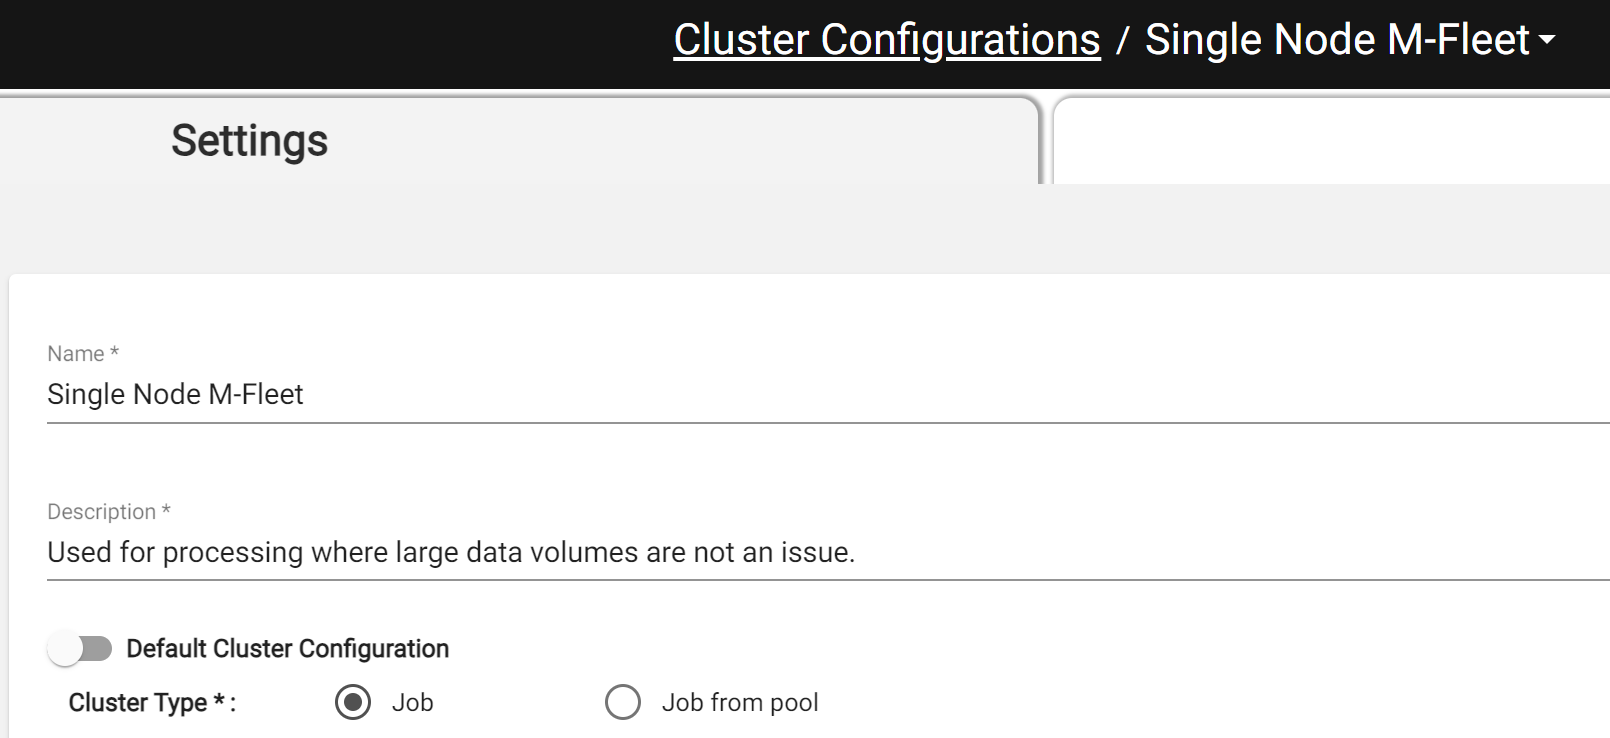
Full Example Compute Configuration of Spot with Fallback
Below are full screenshots of compute configurations set up to use the Spot with Fallback option in both AWS and Azure. The Compute Type needs to be set to Job and the Availability needs to be set to the "Spot with Fallback". All other settings can be adjusted as needed.
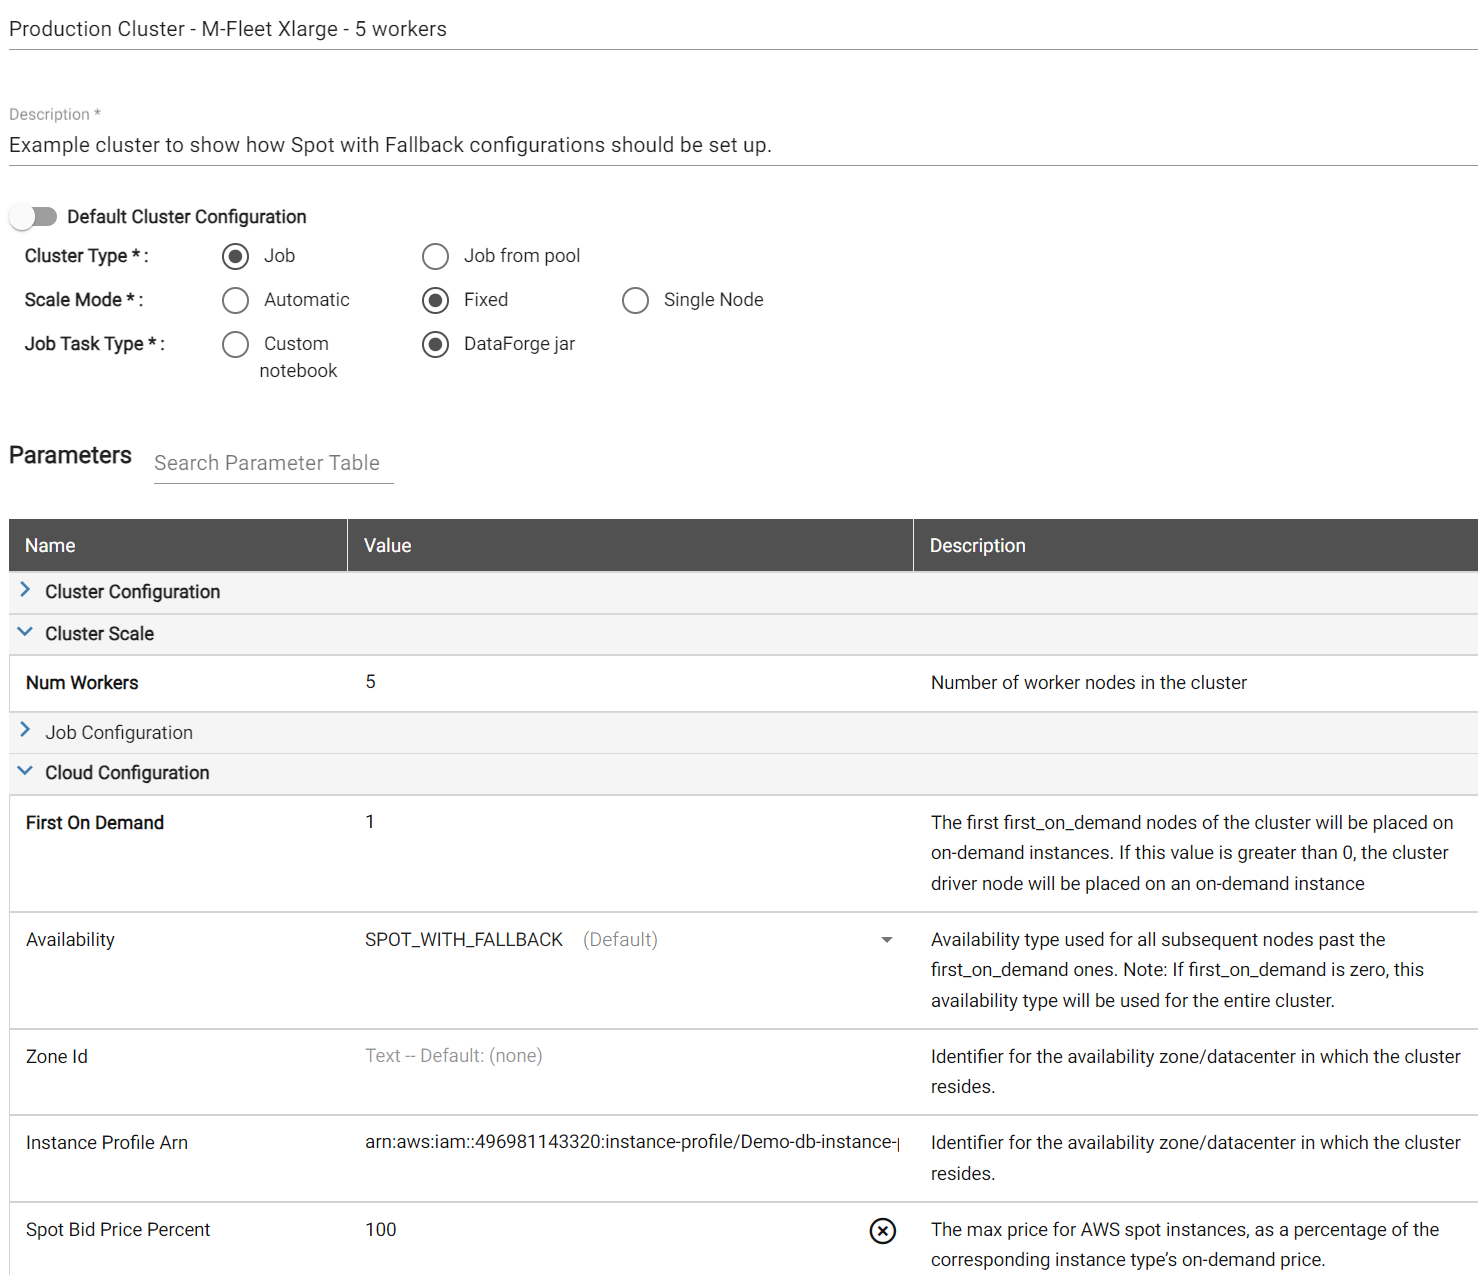
AWS Compute Configuration
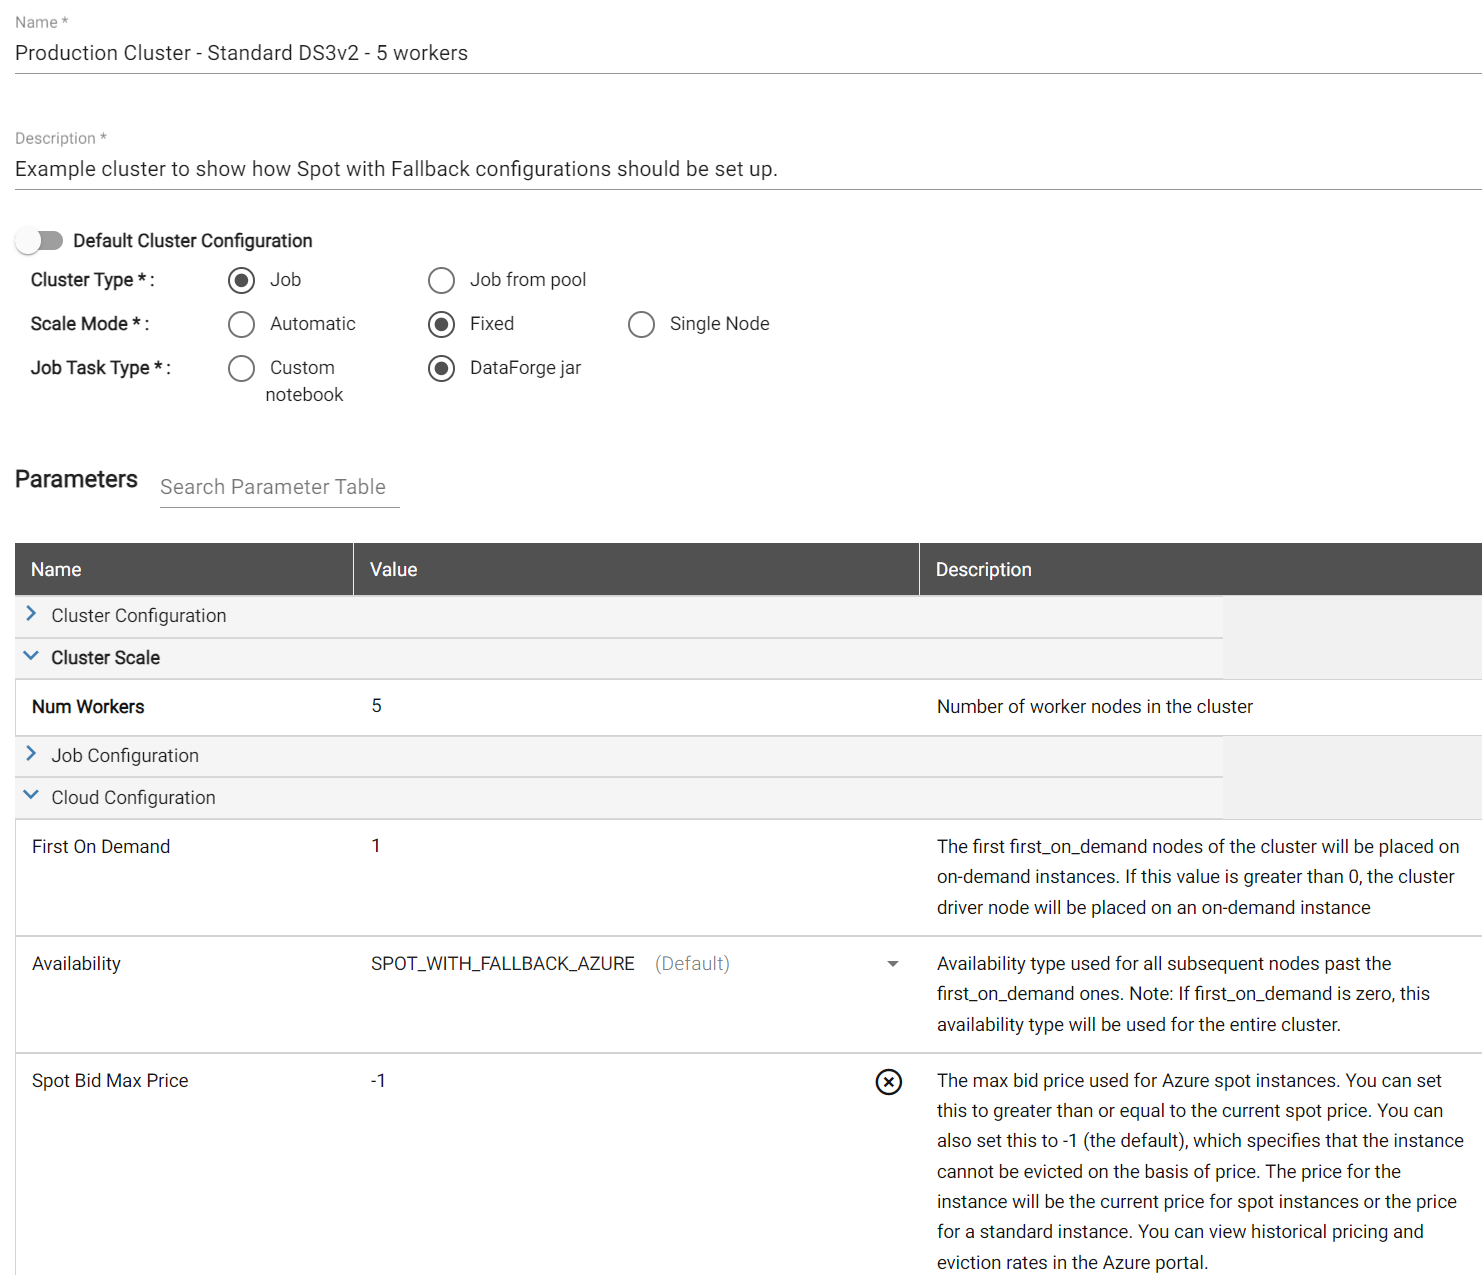
Azure Compute Configuration